Sapflow Using the External Heat Ratio Method

So you want to measure sapflow in plants? You and me both, buddy. The goal of this project is to create an open-source, accurate, robust, low-cost, and low-power system to help answer the age-old question: "How is my plant doing?"
Getting Started
Take a look at the hardware and software sections below for instructions on what you'll need to set up your own system and join in on improving the project.
Hardware
Sapflow Gauge
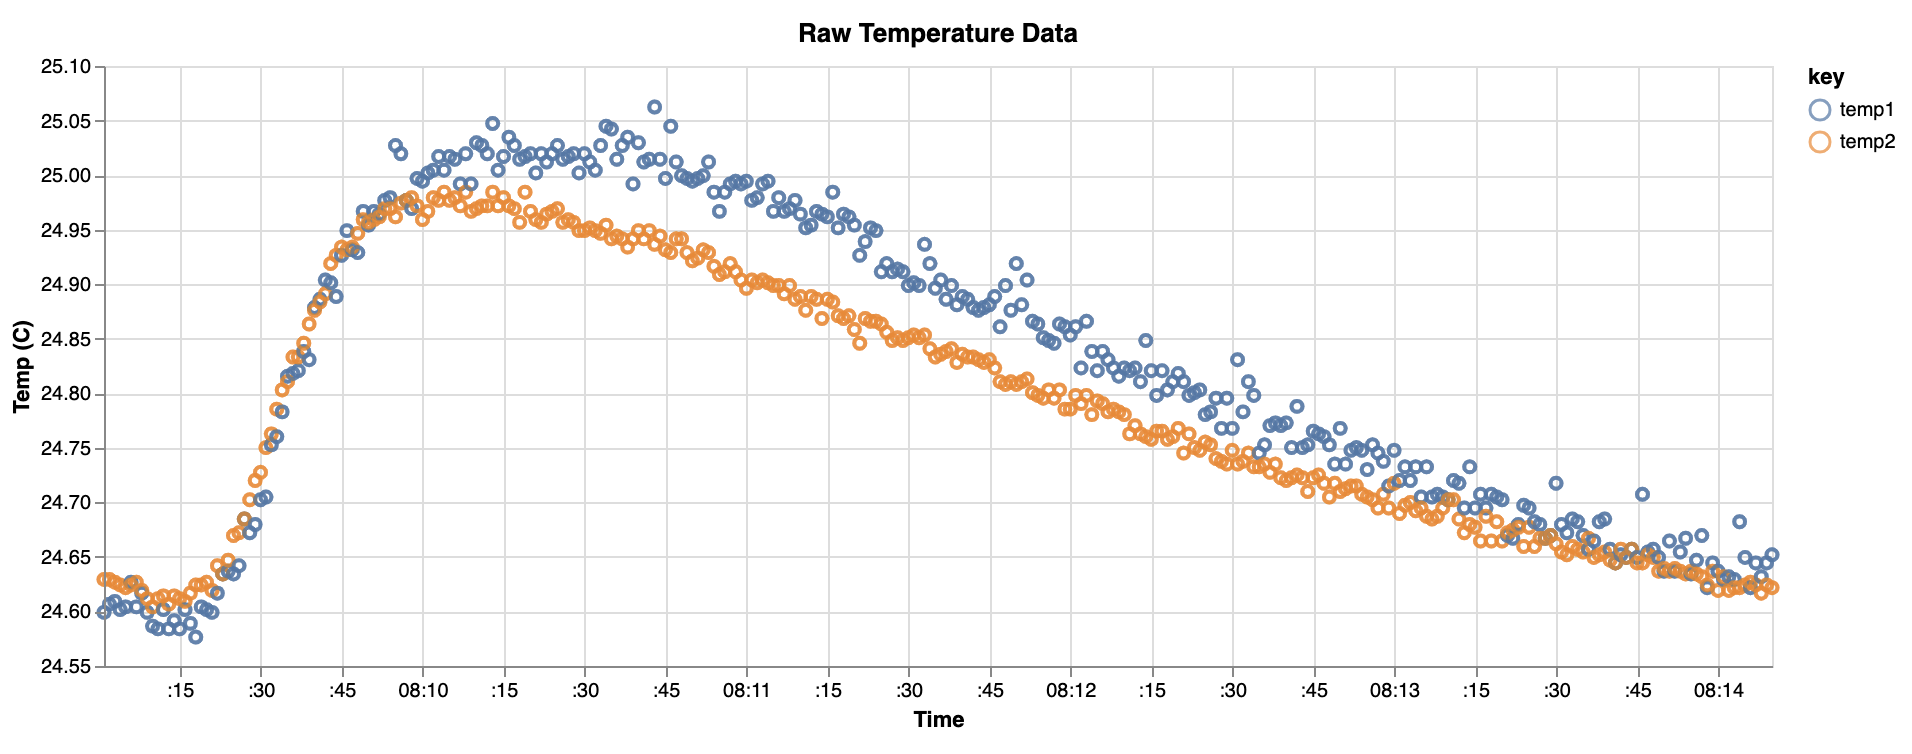
First, you'll need a way to measure and record the temperature at two specific points (equidistant from a central heating element) along the stem of your plant:
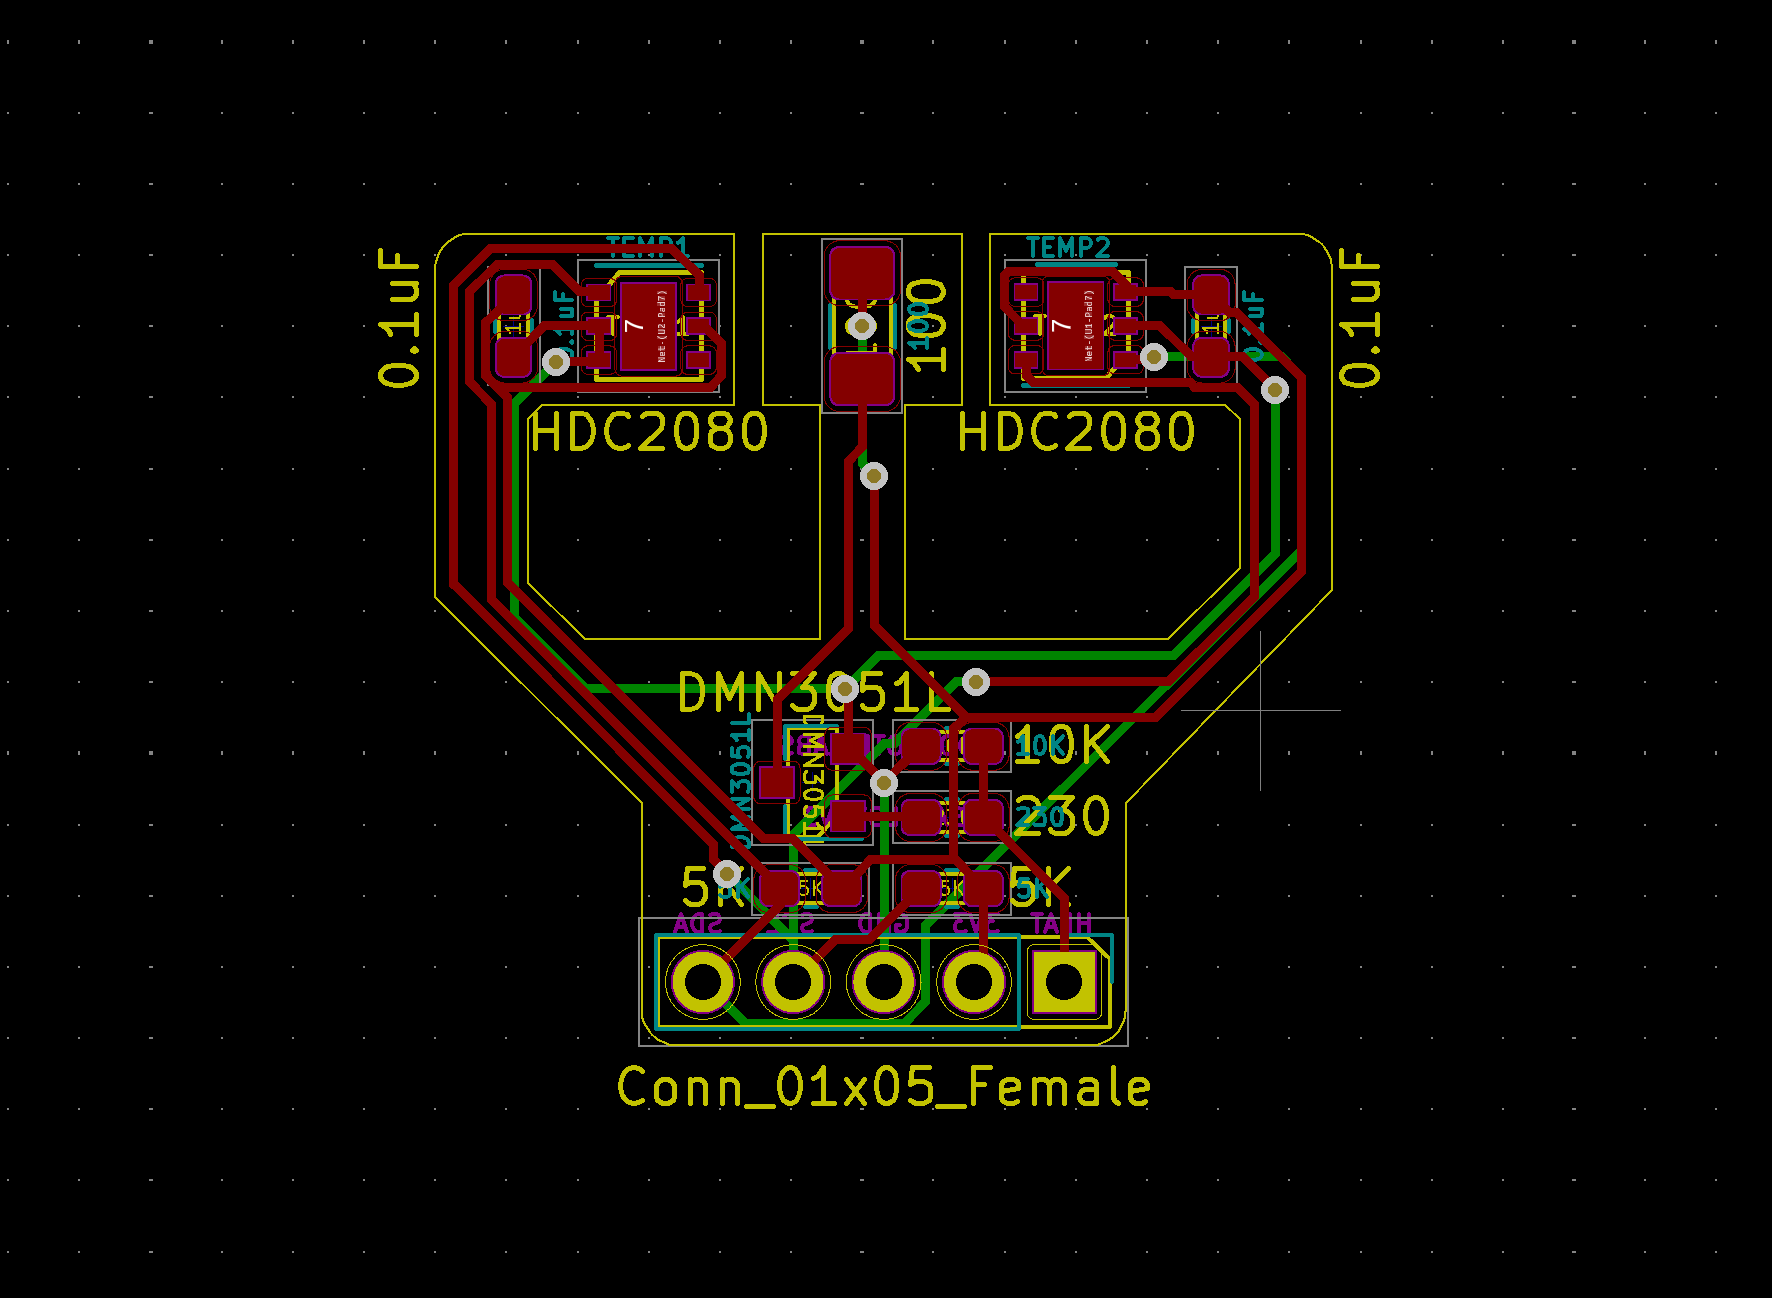
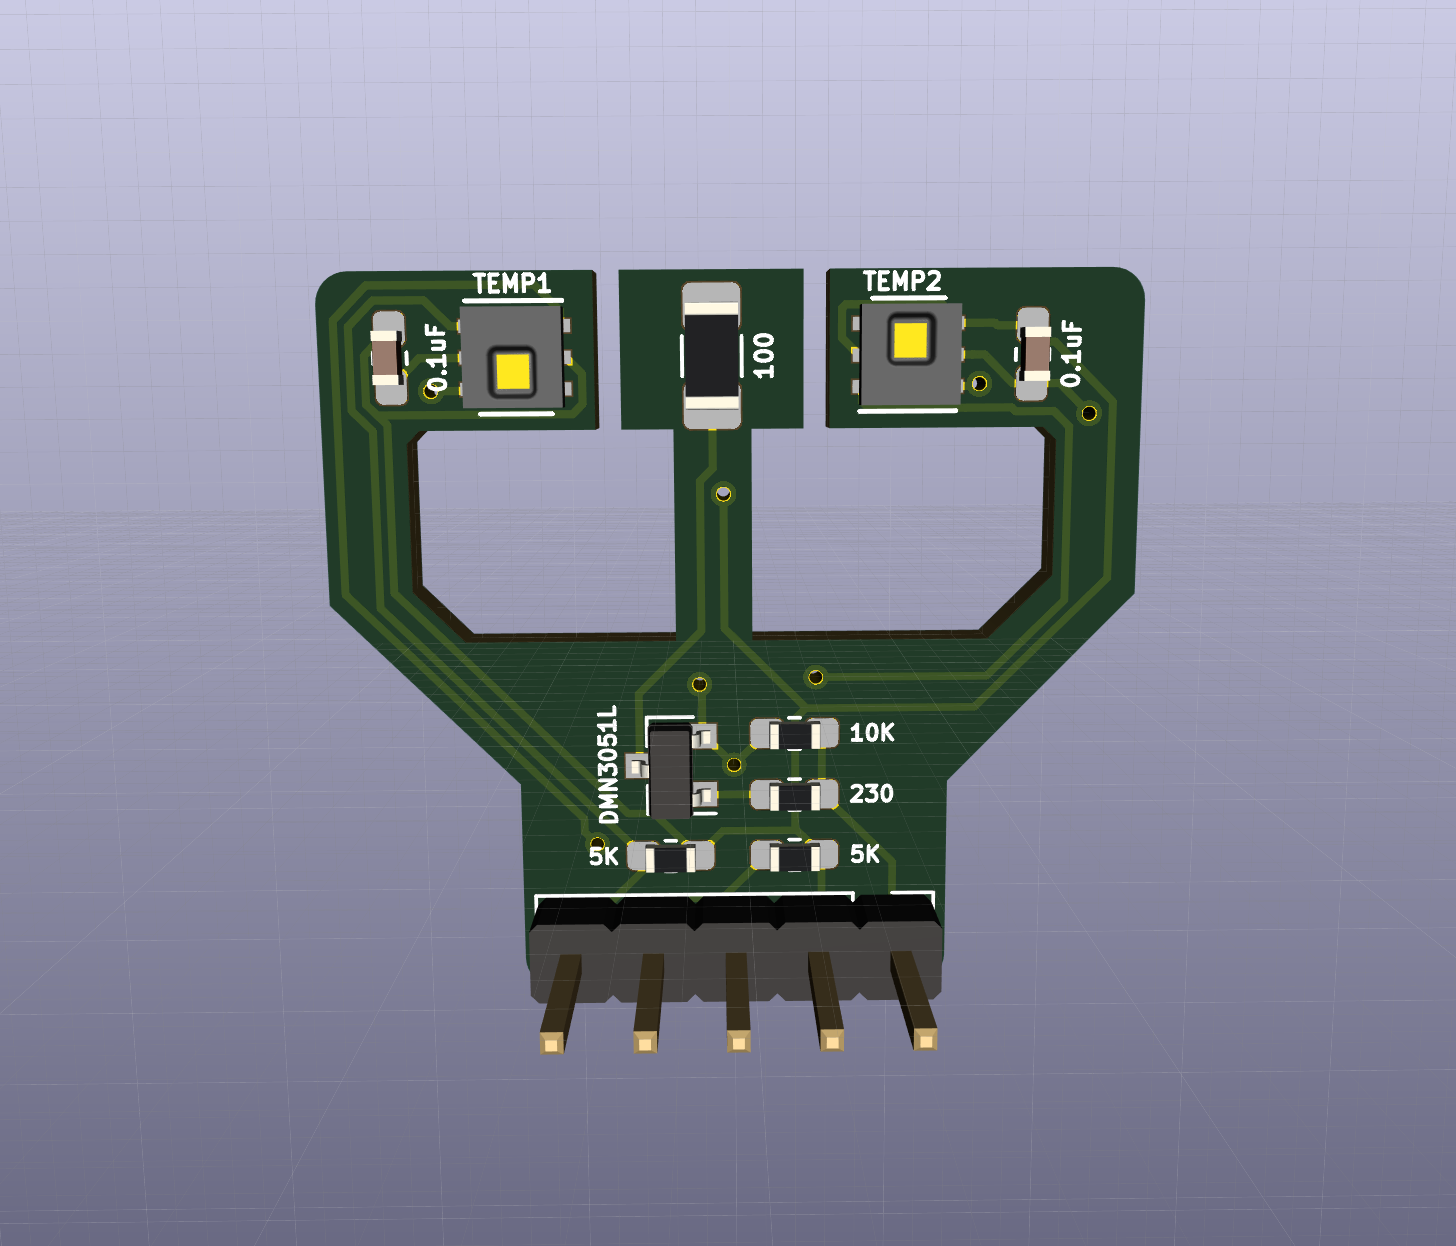
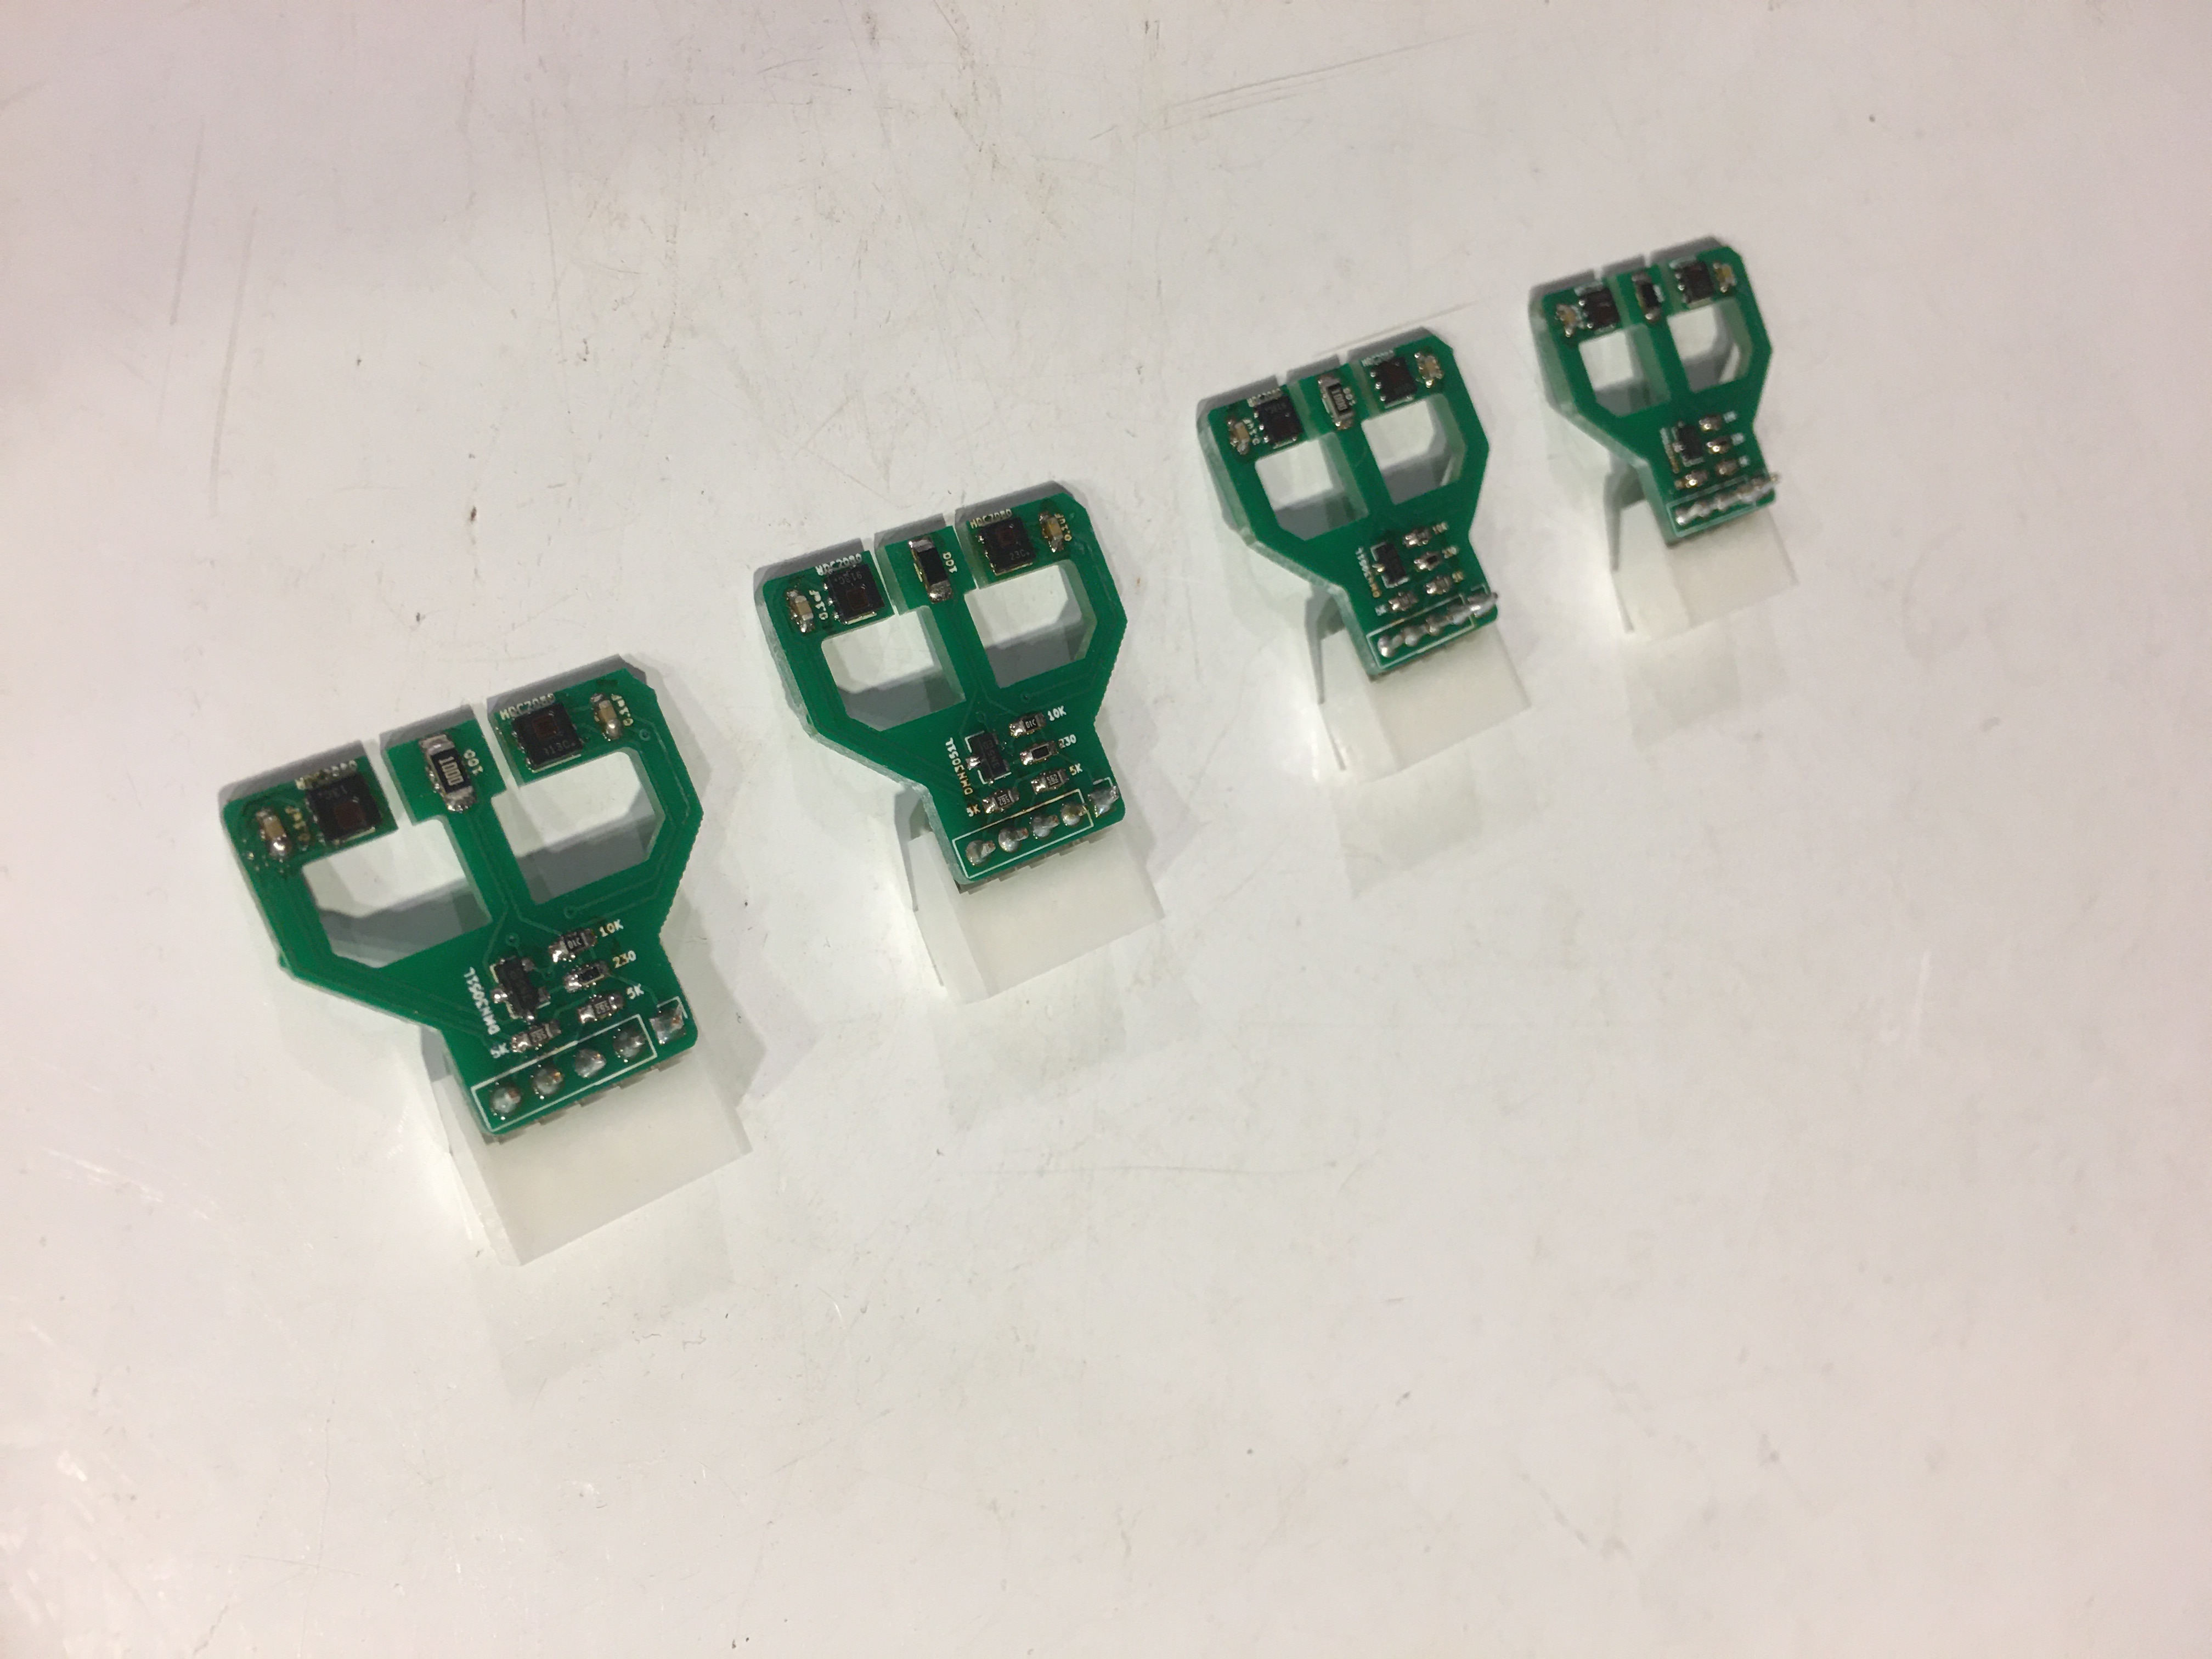
To build the gauge, you'll need: (1) the PCB; and (2) the components.
Fabricate the PCB
See here for the KiCad PCB files. Follow the directions from your favorite PCB fabrication service (e.g., OSHPark, JLCPCB, Seeed Studio, etc.), and order your desired quantity of PCBs.
Gather the Parts
See here for the parts list. Go to your favorite electronic components distributor (e.g., Digikey, Arrow, Mouser, etc.) and order your desired quantity of components.
Microcontroller
Second, you'll need a microcontroller that has an available GPIO pin (3.3V to 5V) and can communicate via I2C. We've found the ESP32 (specifically, the LOLIN D32 Pro. dev board) to be great for rapid prototyping with its relatively large onboard RAM, built-in WiFi, and low cost. For field experiments, it might make more sense to use a board with more low-power optimizations.
Microcontroller Shield
To reduce wiring, you might want to use a shield to interface your microcontroller with the sapflow gauge connector. See here for our shield design for the D32 Pro.
Software
Microcontroller Firmware
You'll need software running on your microcontroller to read data from the connected sapflow gauge. See here for the Arduino code we used for the D32 Pro.
Edge Compute Node
If you're using microcontrollers with WiFi connectivity, it's very convenient to have all of the data streaming into a single place. We like using a Raspberry Pi as an MQTT broker, collecting data points from all of the networked sensor devices. See here for more info.
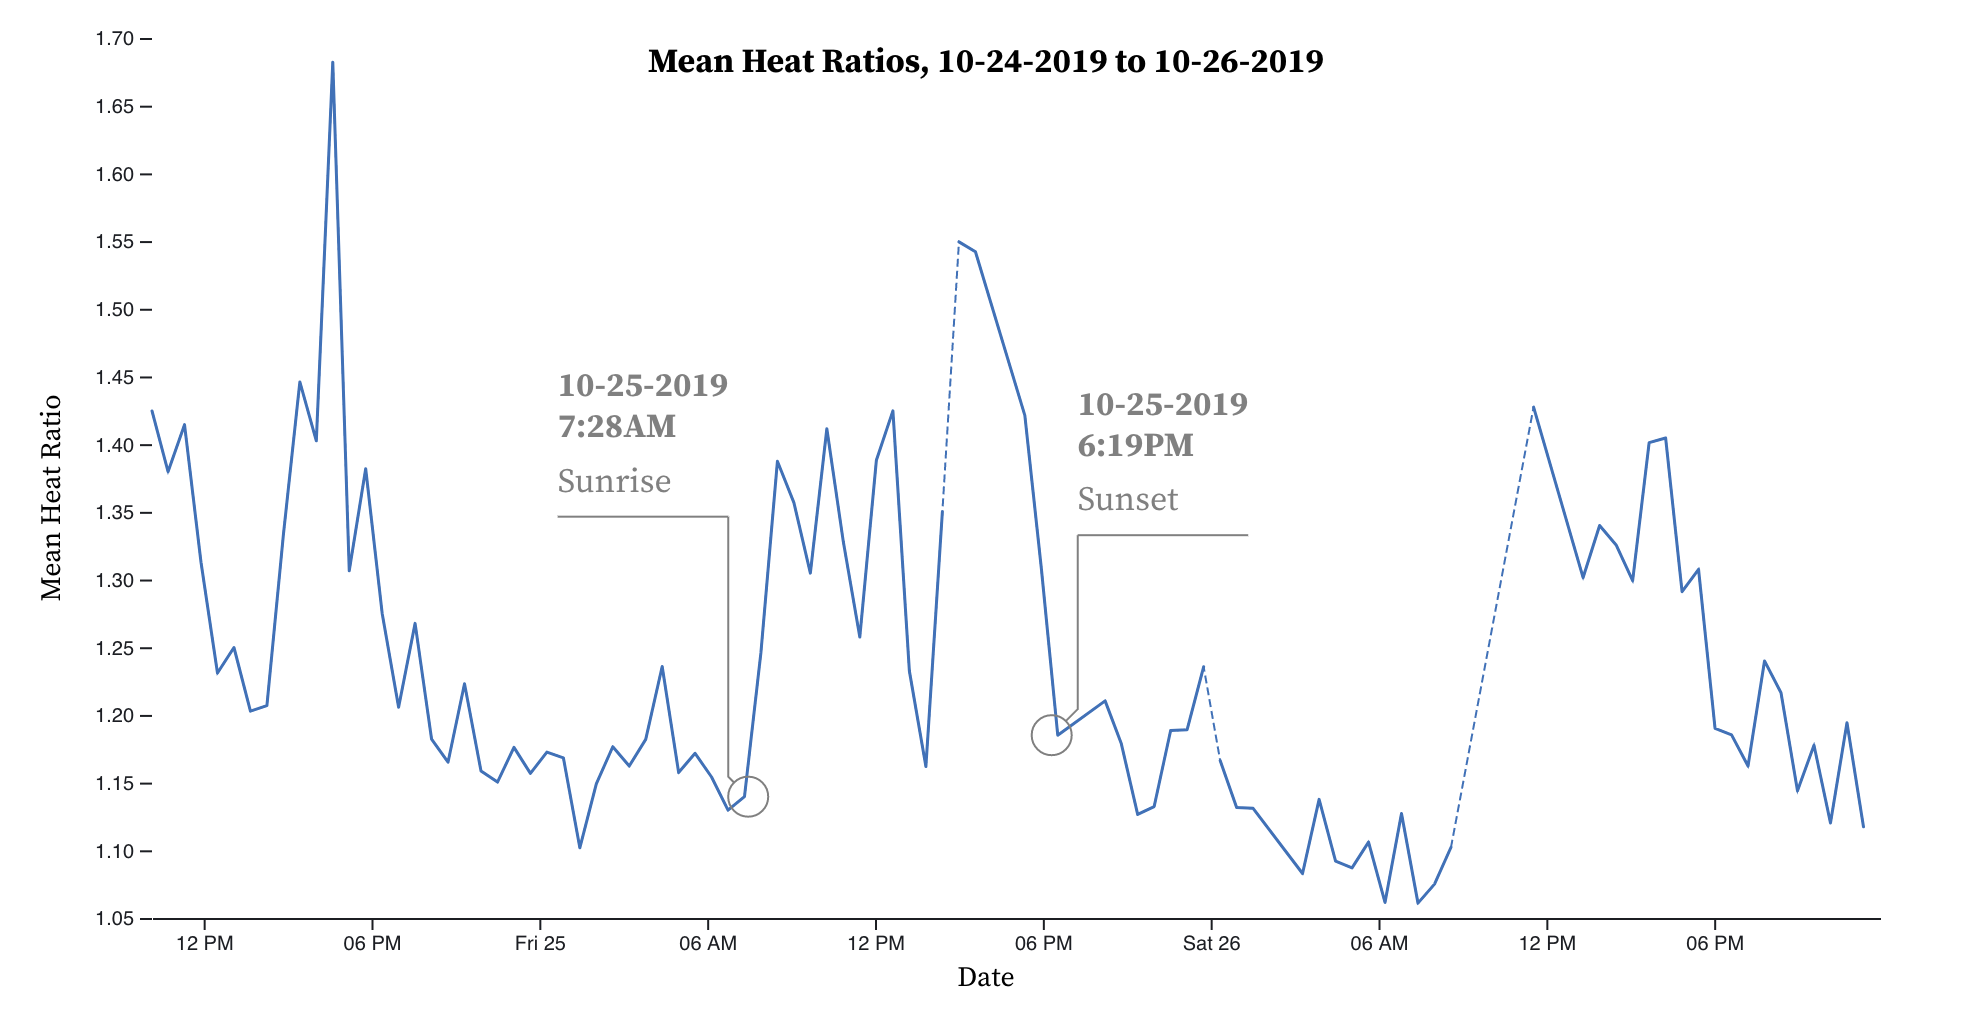
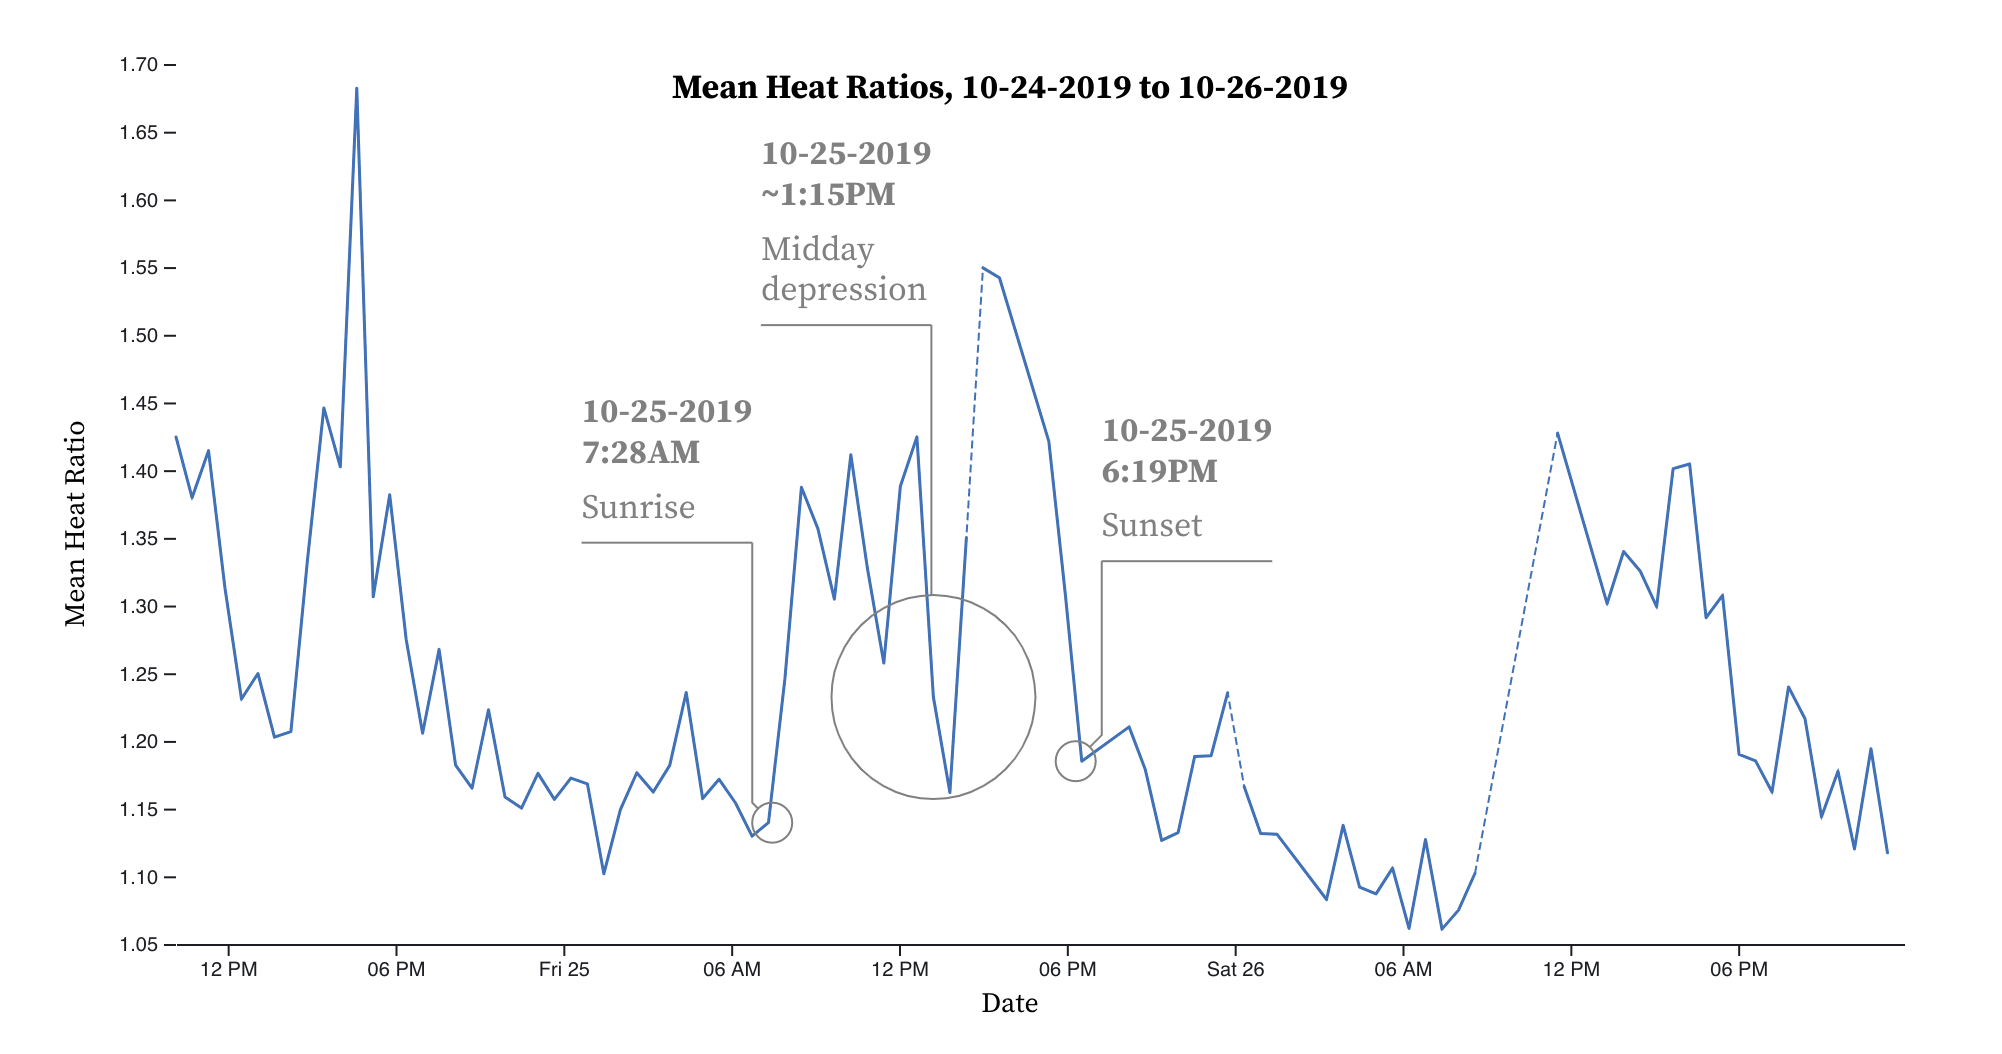
After processing:
References
We've stood on the shoulders of countless giants in working on this project. Below is a non-exhaustive list of the many previous efforts that we drew heavily from (let us know who we've missed and we'll make sure to add them):
Sapflow
- Burgess, S.S.O., Adams, M.A., Turner, N.C., Beverly, C.R., Ong, C.K., Khan, A.A.H., and Bleby, T.M. (2001). An improved heat pulse method to measure low and reverse rates of sap flow in woody plants. Tree Physiology 21, 589–598.
- Clearwater, M.J., Luo, Z., Mazzeo, M., and Dichio, B. (2009). An external heat pulse method for measurement of sap flow through fruit pedicels, leaf petioles and other small-diameter stems. Plant, Cell & Environment 32, 1652–1663.
- Marshall, D.C. (1958). Measurement of Sap Flow in Conifers by Heat Transport. Plant Physiol. 33, 385–396. Skelton, R. (2017). Miniature External Sapflow Gauges and the Heat Ratio Method for Quantifying Plant Water Loss. BIO-PROTOCOL 7.
You'll need software running on your microcontroller to read data from the connected sapflow gauge. See here for the Arduino code we used for the D32 Pro.
Open-Source Research Tools
- Chris Lucani & Team @ Brodribb Lab, University of Tasmania: Open Source OV.
- OPEnS Lab, Oregon State University: Sap Flow Meter.
Kevin Xu
Engineer @ Dotmote Labs