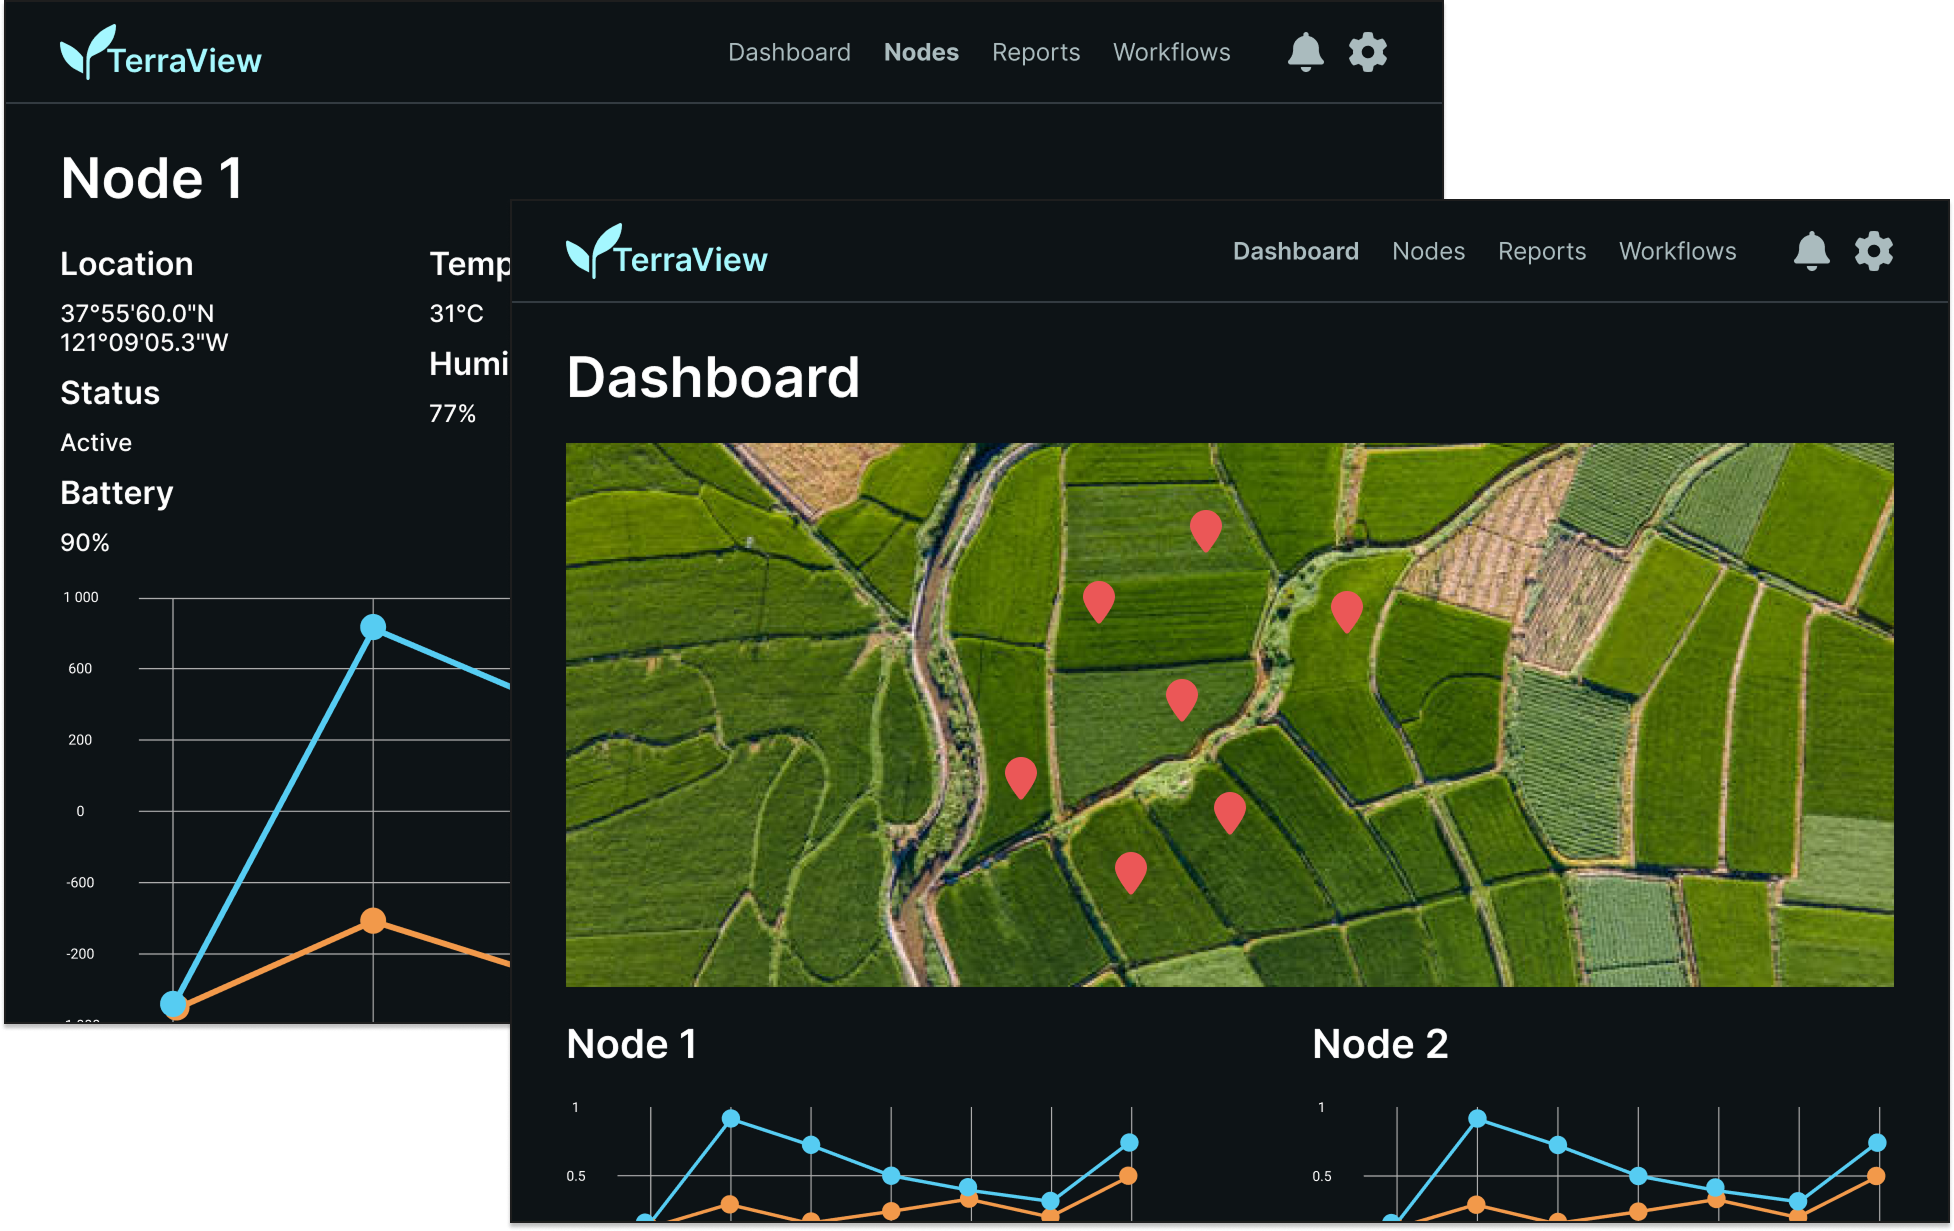
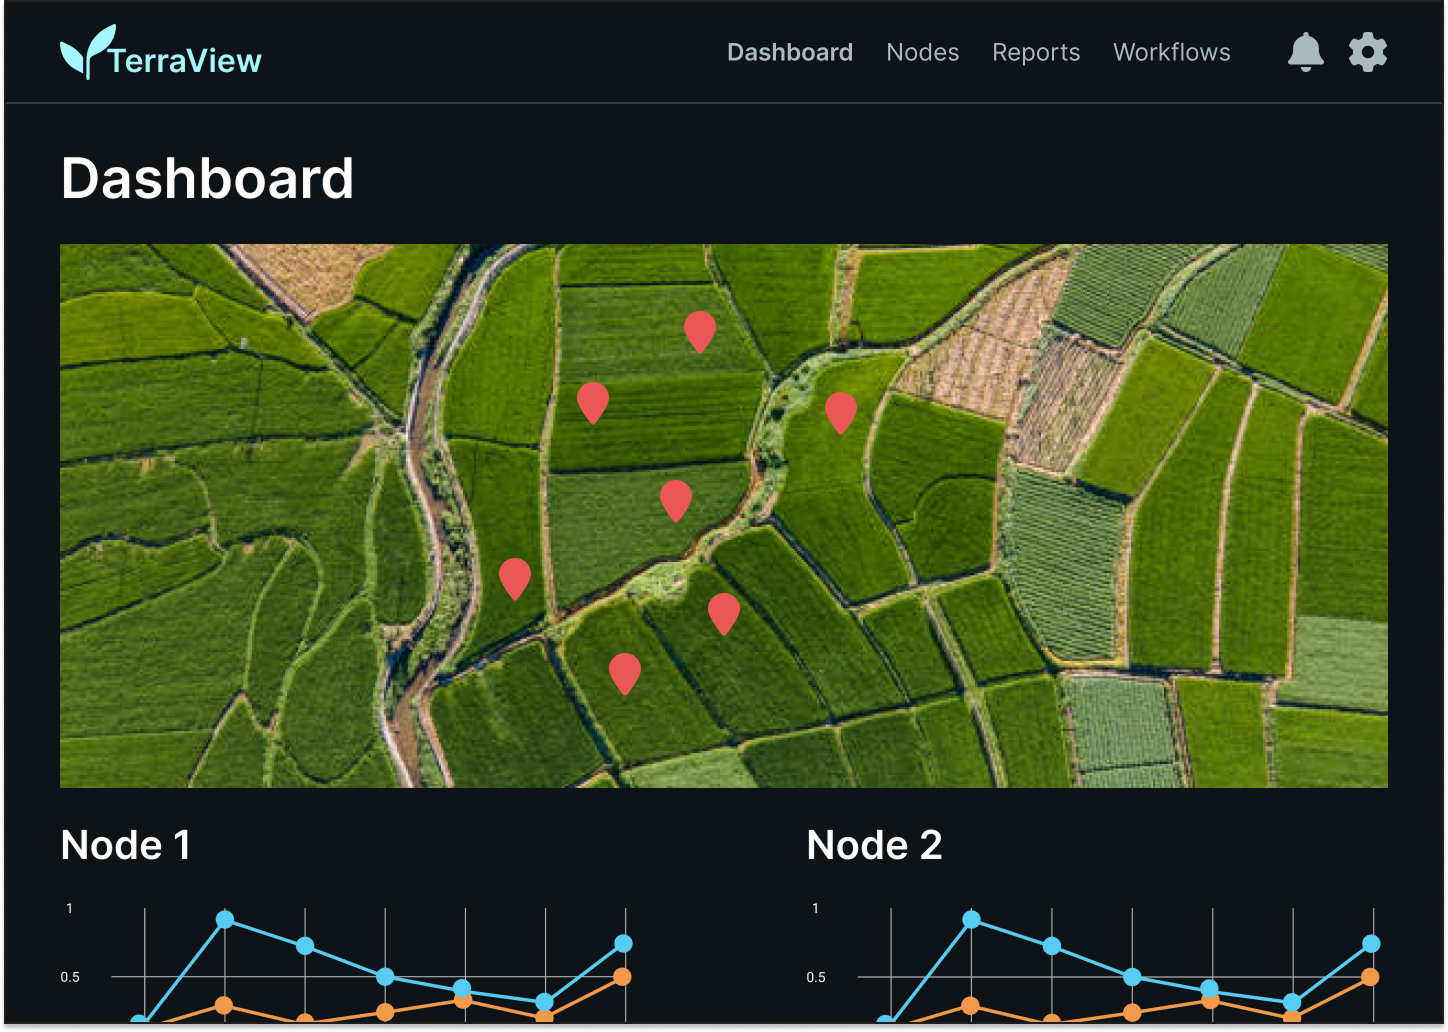
Dashboard
Sensor layout with real-time status.
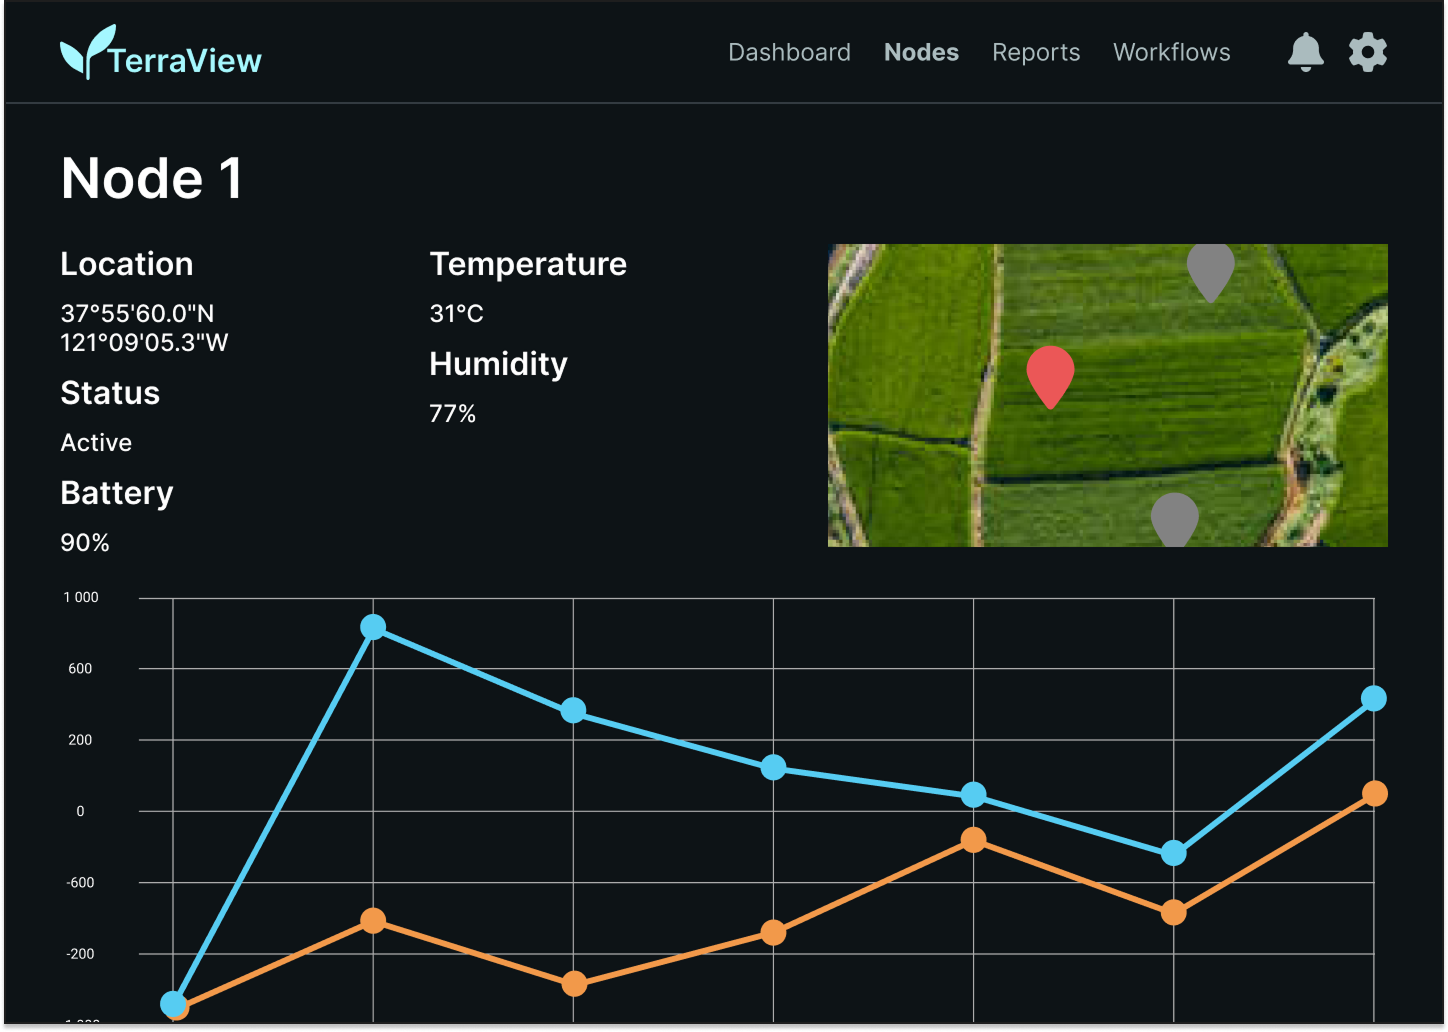
Node Detail
24-hour sensor trends.
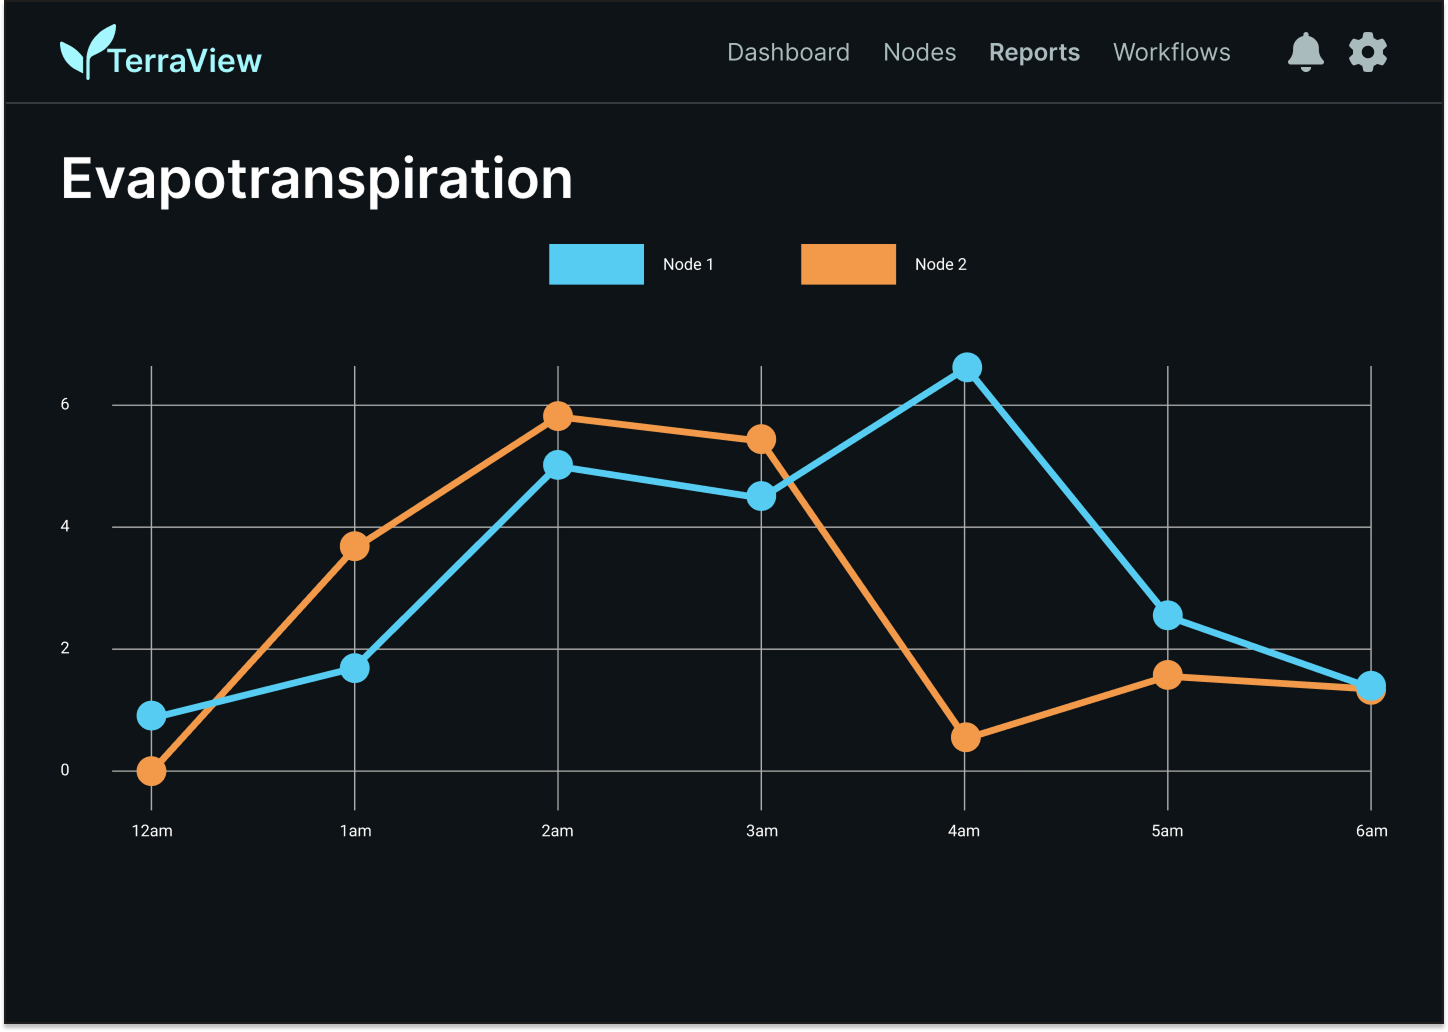
ET Chart
Hourly evapotranspiration visualization.
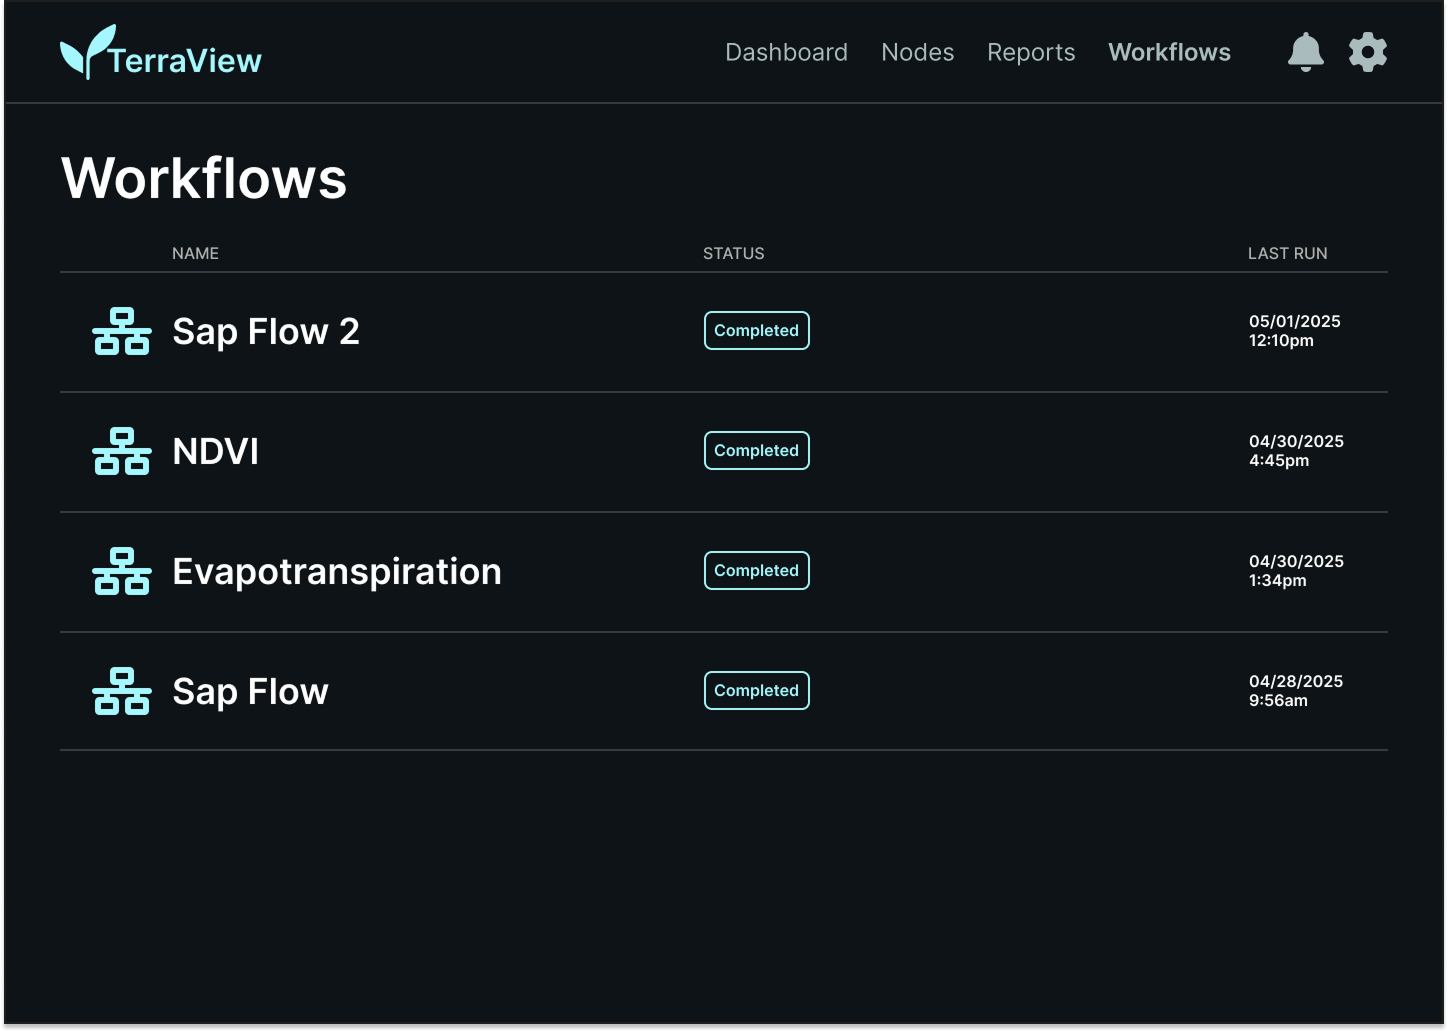
Graphical Editor
Trigger pipelines for NDVI, ET, and sap flow.